A Summer At MongoDB
Written by Luka Kerr on February 16, 2019
After working for a short 10 weeks over the 2018/2019 summer break, I thought I would write up a short post about my experience as a Software Engineering Intern on the Charts team at MongoDB Sydney.
The ‘18/’19 Sydney internship was the first ever Sydney run internship program, with only 6 interns spread across 3 teams (Charts, Storage and TSE), and I feel privileged to have gotten accepted into my first choice team.
Company Culture & Benefits
The MongoDB Sydney office is pretty awesome and having the entire top floor with a balcony is an extra perk.
Some benefits of the internship program include:
- Intern activities (escape rooms, mini golf etc.)
- Drinks and food available whenever
- Ping pong and pool tables
- Delivered choice of lunch
- Brand new Macbook Pro (and monitor) to develop on
- Bacon friday
- MongoDB merchandise
The mentorship provided was also phenomenal. Other engineers would answer any questions immediately, and pull requests were reviewed incredibly fast.
Geospatial Charts
For the span of 10 weeks I worked on implementing three geospatial chart types into the Charts web application. These were scatter, heatmap and choropleth charts.
First lets have a look at the end result:
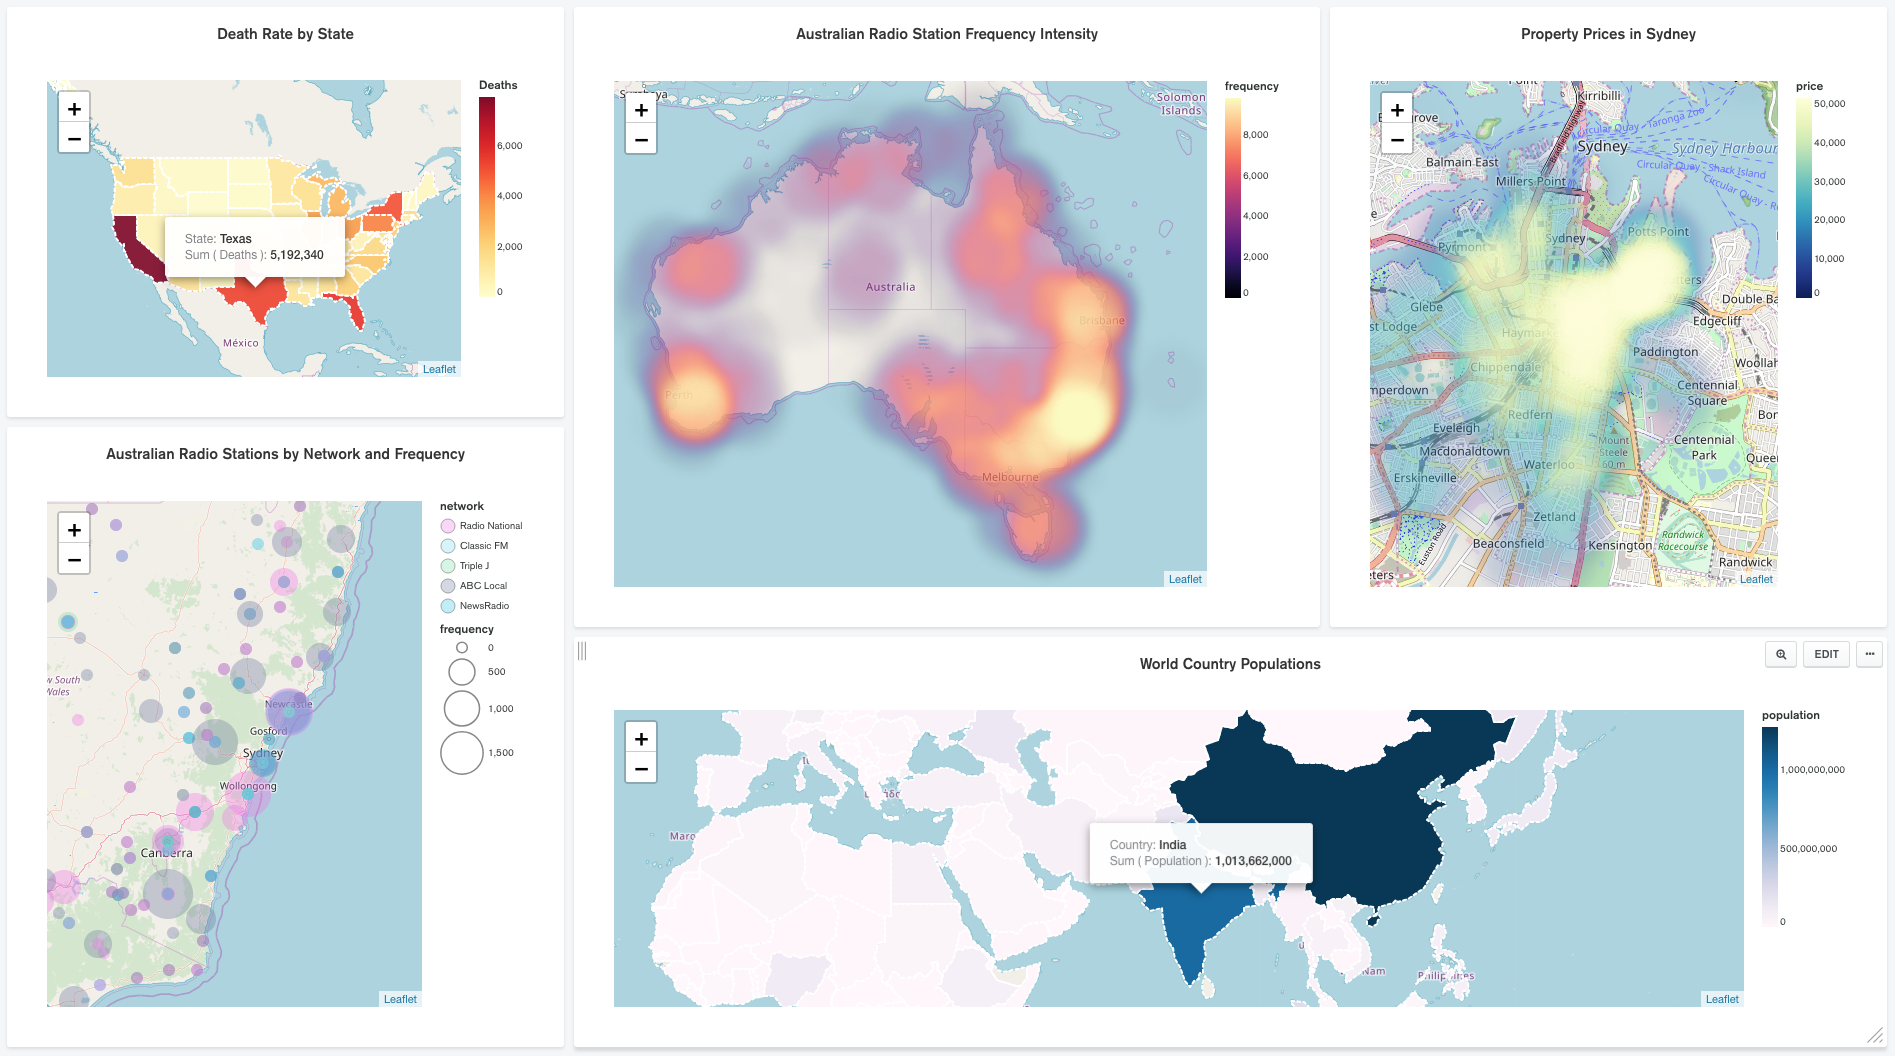
A number of different geospatial charts that can now be created
Implementation
Before I could get started on creating the different geospatial charts, I needed to implement GeoJSON Point semantic type detection.
If you’re not familiar with what a GeoJSON Point is, it’s essentially just an object with a type field, and coordinates array:
{
  type: 'Point',
  coordinates: [125.6, 10.1]
}
As you can see in the image below, whenever a user selects a collection from their database to use as a data source for their chart, a schema of inferred types for each field is generated.
Since I was working with GeoJSON Points, I needed to include this custom semantic type in the schema generation stage.
The end result is that the previous location GeoJSON Point represented as a plain object, is now inferred as a single type.
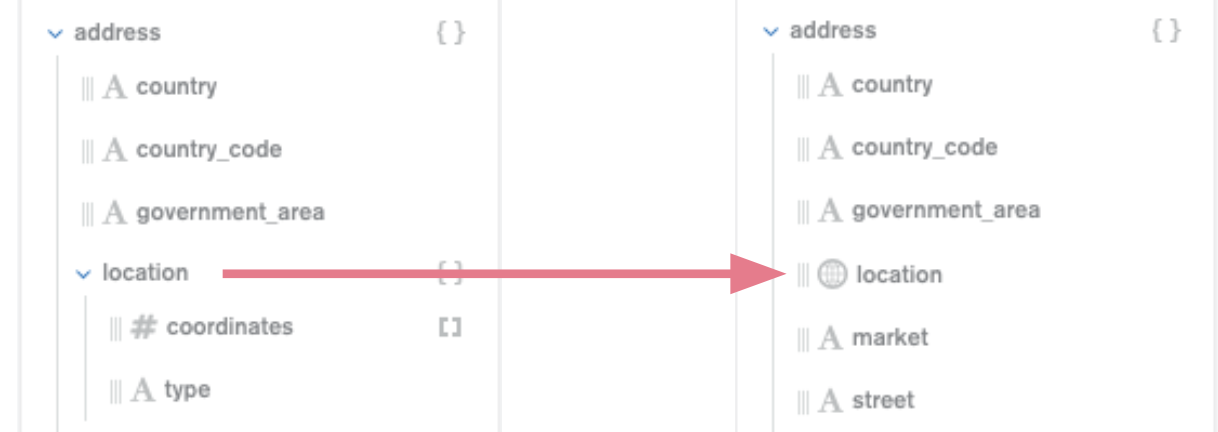
Fields with their inferred types
After this I could begin work creating the three geospatial charts.
Scatter
The scatter chart is a fairly basic chart. It consists of three encoding channels:
- Coordinates
- Color
- Size
These three channels determine the location of each point, its color and its size (normalised to a fixed range).
Most of the initial setup was done during the scatter chart development, including creating reusable and generic components for use later on.
Heatmap
The heatmap chart was probably the most difficult chart to create. This was primarily caused by the fact that GeoJSON Points can’t be aggregated server side very easily.
The reason behind this is that latitude and longitude values are very precise, and without knowing metadata such as the map’s zoom level, Stitch (our serverless backend) would have no knowledge of which points overlapped.
To solve this, I forked the heatmap layer library used, and implemented all the aggregations supported (sum, mean, standard deviation etc.) as streaming functions client side. I also added ~750 lines of tests, up from 0.
Choropleth
The choropleth chart was the least familiar chart amongst other MongoDB engineers, with many having not heard of it before, but still being able to recognize it when shown an example.
This chart was slightly different from the other two due to the fact that rather than using latitude and longitude, specific regions were used. For example the United States or world countries.
Other Features
A few other features were also implemented, these include:
- Setting a custom or automatic viewport
- Setting a custom tile server
- Setting a custom attribution message displayed on maps
All three charts also had a variety of customisations that could be applied, such as:
- Opacity
- Radius
- Stroke thickness
- Gradient color
- Region scheme
Final Remarks
Overall there were 32 geospatial Jira tickets closed, each corresponding to a commit as shown below. There was also ~9,200 additions and just 630 deletions across 169 files.

Work was done using git and an example of the branching model used is shown below:
master
  \
   epic/geospatial
     \
      CHARTS-2059-geospatial-heatmap
      CHARTS-2012-fix-geojson-point-detection
      ...
On my last day, the epic/geospatial branch was finally merged into master as shown in the pull request
image above.
Out of my (at time of writing) 3 internships, I would say that MongoDB has been the most fun and enjoyable one, and I can’t wait to apply again next year.